PowerChart is a new Chart Control for PowerBuilder, introduced with PB Ultimate Suite 2019 (PBUS 2019).
It offers several types of graphs (Pie, Bar, Donuts, Lines...)
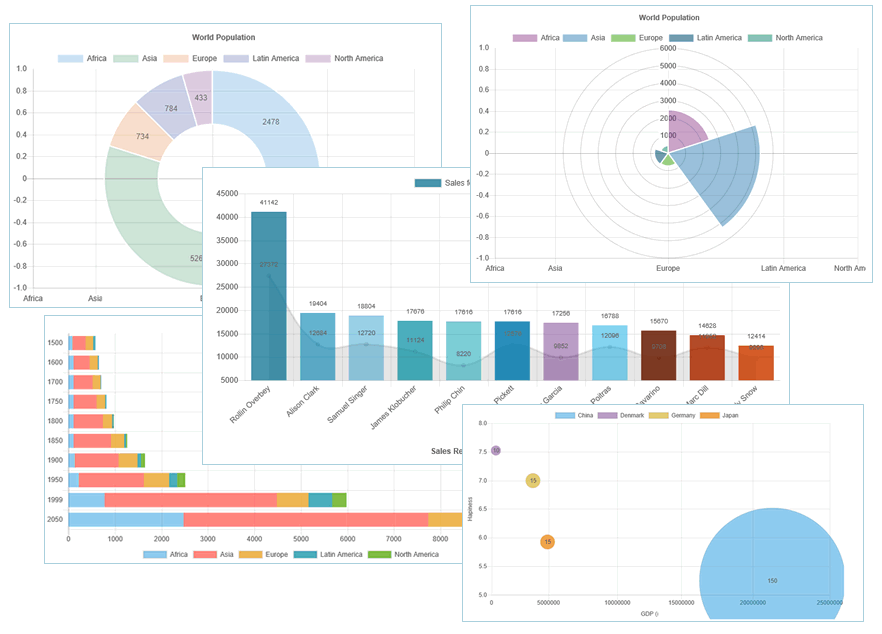
Charts are animated, clickable, and can be included and printed with PB reports.
PowerChart adds a modern presentation layer to your DataWindows.
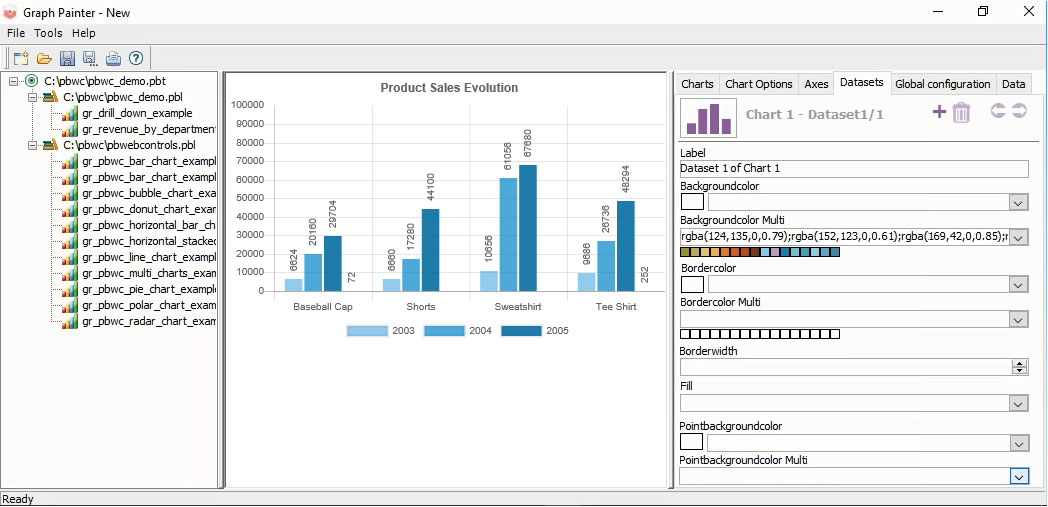
No need to write code: just select a DataWindow and design the Chart with a dedicated painter.
Capture the interactions of the user with any part of the chart to implement powerful features:
- Drilling down from one chart to another, to visually analyze business data
- Synchronizing several charts and DataWindows with a master-detail relationship
- Building a modern, animated dashboard to visualize data and KPI
Download PBUS 2019 to add modern charts to your PowerBuilder application.